The Great Productivity Divide: Who Wins When AI Changes the Economic Speed Limit?
By Asymmetric Analytics
Analysis
Imagine three industrial economies entering a new technological age.
One has deep capital markets, leading frontier AI developers, and the capacity to pour hundreds of billions of dollars into computing infrastructure. One has an enormous manufacturing system, vast factory automation, and an ability to turn advances in software and machinery into physical output at scale. The third has world-class engineers, established industrial companies, and wealthy consumers—but substantially higher energy costs and a chronic productivity disadvantage.
The first is the United States. The second is China. The third is much of the European Union.
The result is not predetermined. What matters is that the AI revolution may amplify strengths and weaknesses already visible in official data. The biggest danger is not being behind today. It is being behind in an economy where productivity differences can compound faster than they once did.
Brief: the new economic speed limit
The immediate catalyst is America's third-quarter growth report. The Bureau of Economic Analysis reported U.S. real GDP expanding at a 3.4% annualized rate, up from 2.2% in Q2, while quarterly annualized core PCE inflation cooled from 3.3% to 2.5%.
That is not proof that artificial intelligence caused the improvement. It does pose an important monetary-policy question: if technology expands productive capacity, does a fast-growing economy necessarily need the same interest-rate brake?
The central comparison is private AI-company financing, not total business or government AI spending: the Stanford AI Index measured $285.88 billion in the United States, $20.92 billion in Europe and $12.41 billion in China in 2025. Europe includes countries outside the EU, and Chinese state-directed financing is not captured on the same basis. The U.S. figure was therefore 13.7 times Europe's.
For an international comparison, GDP alone is a blunt instrument. The more revealing yardstick combines output per hour, costs per unit of production, energy availability, AI and automation investment, and the ability to turn inventions into commercial output.
Standard: the transatlantic gap is already real
The OECD's 2026 productivity compendium found that in 2024 real GDP per hour worked rose 2.2% in the United States and only 0.2% in the European Union. The EU's output per hour was approximately three-quarters of the American level using constant purchasing-power-parity comparisons.
Preliminary 2025 figures showed an improvement, with EU productivity rising 1.4% versus 1.7% in the United States. But the deeper gap remains. For a high-cost economy, persistently slow productivity growth is a particularly serious problem: living standards ultimately depend on how much useful output each hour of work produces.
Not all of Europe shares the same trajectory. OECD figures showed strong 2024 productivity increases in Poland, Bulgaria and Denmark, while Germany and Italy experienced declines. Germany also remains one of the world's most robot-intensive manufacturing economies. Europe is not devoid of industrial advantages; those advantages are unevenly distributed.
American private AI investment was nearly fourteen times Europe's in 2025
The Stanford AI Index 2026 reported $285.88 billion of U.S. private AI investment in 2025, against $20.92 billion in Europe and $12.41 billion in China. The Stanford comparison covers privately financed AI companies, not total spending by all businesses on AI adoption or governments on research. Europe's total includes countries outside the EU. China's state-directed financing is not captured on the same basis. The U.S.-to-Europe ratio is 13.7 to one (285.88 divided by 20.92).
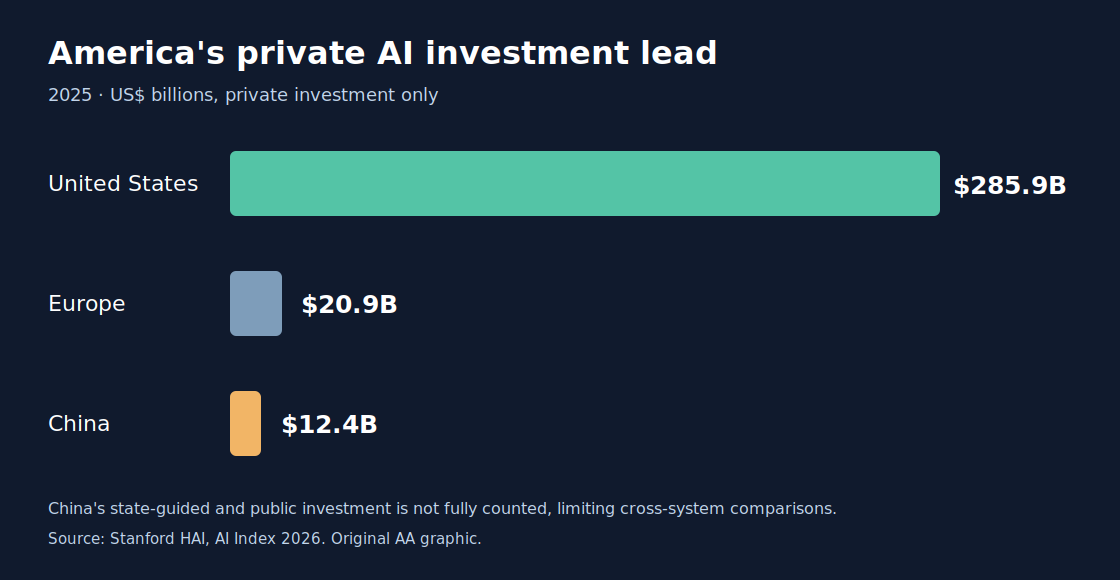
Nevertheless, America's lead in privately financed AI development is striking. The United States has capital markets, cloud companies, large enterprise customers, leading research institutions and strong incentives to commercialize technology. If deployed AI measurably lowers unit costs, those advantages could reinforce each other.
The constraints are physical. AI needs electricity, transmission networks, transformers, chips, cooling and construction. The IEA estimated that data centers accounted for half the growth in U.S. electricity use in 2025. The economic question is whether America's infrastructure expansion keeps pace with its extraordinary computing ambitions.
China: the factory is already automated
China's defining advantage is not simply its ability to create AI models. It is the scale of the manufacturing ecosystem into which software, robotics, industrial sensors and new equipment can be deployed.
The International Federation of Robotics reported that Chinese factories installed 354,000 industrial robots in 2025, representing 59% of worldwide installations. The United States installed nearly 38,500; Germany fewer than 25,000.
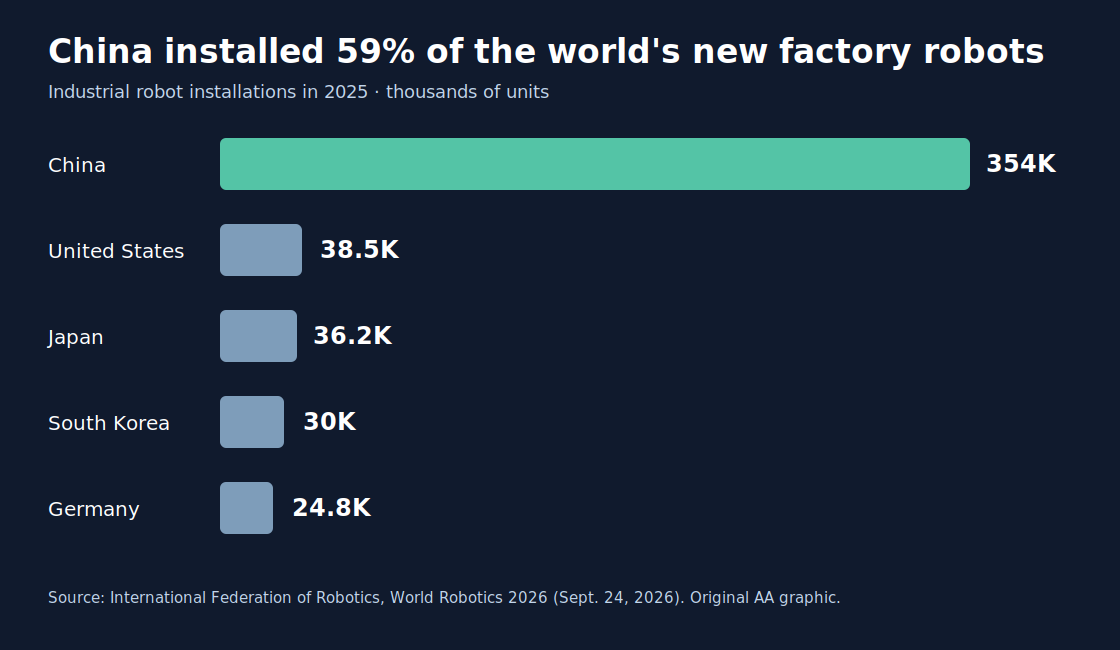
China's official January–September 2026 statistics show high-tech manufacturing value added expanding 14.3% year over year, well above the 4.6% increase in total real GDP over the same period.
But the phrase full speed ahead needs qualification. China's fixed-asset investment fell 7.2% in the first nine months of 2026, with private investment falling 10.4%. Its advanced manufacturing sectors are powerful while other parts of the economy face substantial weakness.
The most consequential comparative question may be whether American AI capabilities increase the productivity of U.S. knowledge work faster than Chinese automation increases the productivity and scale of physical production. Either advantage could influence global prices.
Europe: the compounding cost of high energy prices
The IEA's Electricity 2026 found that 2025 electricity prices for large energy-intensive EU industrial users remained more than twice those in the United States, and around 50% higher than in China.
That disadvantage matters for chemicals, steel, metals, industrial machinery and the increasingly energy-intensive computing infrastructure used to train and run AI.
The causal chain is straightforward. Higher energy costs can compress industrial margins. Lower profits leave less capital for modernization. Slower investment risks weaker productivity. Weak productivity, in turn, leaves companies less able to absorb high energy and labor costs. The process can reinforce itself.
European industry already shows signs of pressure. Eurostat reported that total EU industrial production fell 0.2% year over year in August 2026, while the euro area fell 1.1%.
Europe's economy is not contracting uniformly. The Q3 2026 preliminary GDP estimate showed the EU growing 1.5% year over year. Spain grew 2.7%, while Germany registered 1.2% and France contracted 0.1%. The differences are not trivial.
The European Commission has acknowledged the structural problem and adopted a Competitiveness Compass aimed at innovation, affordable energy, and reducing barriers to growth. The question is whether reforms reduce actual costs and accelerate deployment before the competitive distance widens further.
Could America grow three times faster than Europe for a decade?
It is a powerful hypothesis, and the near-term comparison already points to a meaningful gap. The OECD's September 2026 interim outlook projected U.S. real GDP growth of 2.2% in 2026 and 2.1% in 2027, against 1.0% in each year for the euro area. The euro area is not the entire European Union, but it encompasses its largest economies. Those projections imply roughly twice the annual growth rate in the immediate period, not a settled ten-year outcome.
The longer-run difference becomes striking through compounding. As an illustrative scenario, not a forecast, imagine U.S. real GDP growing 3% annually for ten years while the euro area grows 1%. After a decade, American output would be about 34% above its starting level, compared with roughly 10% for the euro area. That is more than three times the percentage increase in economic output—without Europe experiencing an outright contraction.
What would make the scenario plausible? Sustained AI productivity gains, abundant and affordable energy, rapid commercialization, investment in grid and manufacturing capacity, and continued access to technical talent. What could defeat it? Infrastructure bottlenecks, poor returns on AI investment, fiscal or trade shocks, or Europeans using imported American and Chinese AI to raise their own productivity.
One overlooked distinction: where AI companies raise financing is not where all productivity benefits must appear. The Stanford AI Index 2026 reports AI use at 91% of European organizations and 90% in North America in one organizational survey. This measures reported adoption in at least one business function, not realized efficiency gains, but it shows that Europe can adopt AI without matching U.S. venture investment.
The test for the next decade is therefore not the ratio of AI funding alone. It is whether the investment gap translates into a persistent gap in measured output per hour, energy-adjusted production costs, and real GDP.
Detailed: will American elections interrupt the acceleration?
American industrial policy is less easily divided into one administration's program than campaign rhetoric suggests.
The CHIPS and Science Act of 2022 was enacted during the Biden administration with bipartisan support. The Trump administration's July 2025 data-center permitting order emphasizes infrastructure approvals, energy and semiconductor expansion.
There is material continuity in the broad objective of strengthening domestic technology and semiconductor capabilities, even as administrations disagree on regulation, climate priorities, subsidies, trade and research spending.
A GAO report from August 2026 illustrates both continuity and discontinuity: U.S. semiconductor manufacturing incentives continued, reaching 49 funded projects by July, while much of the earlier advanced-microelectronics R&D effort was canceled or restructured.
The scale behind that policy question is private AI-company financing, not total business or government AI spending. The Stanford AI Index measured $285.88 billion in the United States, $20.92 billion in Europe and $12.41 billion in China in 2025. Europe includes countries outside the EU, and Chinese state-directed financing is not captured on the same basis. The U.S. figure was therefore 13.7 times Europe's.
China's manufacturing counterweight is deployment: its factories installed 354,000 industrial robots in 2025, or 59% of worldwide installations, compared with nearly 38,500 in the United States and fewer than 25,000 in Germany.
That distinction matters more than assumptions about either party's campaign rhetoric. Private firms undertake multiyear investments. Federal choices affect the economics, but no election automatically causes a wholesale reversal or guarantees continuity. The most meaningful policies to monitor are energy and transmission permitting, chip manufacturing and R&D, skilled technical talent, export controls, and the treatment of capital investment.
Other contenders: smaller countries, specialized strengths
South Korea has a large advanced manufacturing and semiconductor base and world-leading robot density. It can benefit from an AI hardware and memory cycle even without matching U.S. private AI investment.
Japan has deep robotics, precision-equipment and industrial know-how, though its economy-wide productivity growth and aging workforce create challenges.
India offers a large technology workforce and expanding industrial ambitions. The IFR reported roughly 10,500 new robots installed in 2025, up 15%, but from a far smaller factory-automation base than China. Catch-up growth and frontier leadership are different phenomena.
Taiwan remains central to the advanced-chip supply chain, giving it economic leverage but also an unusually concentrated exposure to geopolitical disruption.
The lesson is that the world will not divide neatly into three exclusive national winners or losers. Countries and companies can dominate particular pieces of a globally integrated technology stack.
How to tell whether the thesis is right
Instead of assigning nations permanent labels, we would maintain a Productivity Divide Monitor with five comparable measures: real GDP per hour worked; real unit production costs; industrial electricity prices and available capacity; realized AI productivity returns; and automation deployment alongside manufacturing output.
The strongest signal would be faster real output accompanied by moderating unit costs, sustained across several years and industries.
There are three important counterarguments. First, AI adoption could diffuse internationally much faster than local model development or investment, allowing late adopters to catch up. Second, an expensive AI infrastructure boom may deliver weak returns or bottlenecks that delay productivity improvements. Third, Europe's political and industrial response could narrow its disadvantages, while China's investment slump or America's energy and fiscal constraints could undercut their apparent leads.
None of these possibilities erases the measured differences. They tell us what observations would change the interpretation.
The next economic divergence
The Federal Reserve faces a domestic version of the same question. Economic growth used to be interpreted against an estimated potential growth rate that changed slowly. But AI and automation might change the path of potential output.
Internationally, the consequences would be profound. An economy that grows through rising productivity can produce more without commensurate price increases, finance new investment, and compete on cost. An economy that struggles to raise productivity while absorbing expensive energy and aging infrastructure may face a very different future.
The defining economic divide of the coming decade may be between countries that turn intelligence into abundant production and those that cannot.
Primary evidence and data sources
OECD: Compendium of Productivity Indicators 2026
Stanford HAI: AI Index 2026, Economy
Eurostat: Third-quarter 2026 GDP flash estimate
China NBS: First nine months of 2026
China NBS: Fixed-asset investment