The AI Investment Paradox: Wall Street Counts the Cost. Who Captures the Value?
By Asymmetric Analytics
Analysis
The sums being invested are extraordinary. So are the opportunities those investments may enable. The difficult question is who will convert that potential into durable economic value.
When Meta reported its third-quarter results on October 21, 2026, it described a business generating $64.6 billion in quarterly revenue while spending $34.91 billion on capital expenditures, including finance-lease principal payments. Its $32.79 billion of operating cash flow did not fully cover that investment, and quarterly free cash flow was negative $2.12 billion.
Nine days later, S&P Global Ratings revised Meta's outlook to negative , citing uncertainty around AI investment and future cash generation. Investors have a legitimate financing question. Enormous data centers must earn their keep.
But there is a second question with potentially larger consequences. What if financial markets are so busy calculating the cost of constructing the AI economy that they are underestimating the economic value that infrastructure will enable?
The answer cannot come from the next earnings call alone. It depends on a second transformation, inside the organizations that will use the technology.
Brief
Microsoft offers a useful historical contrast. In its June 2016 quarter , Azure revenue grew 102% while Intelligent Cloud operating income fell 17% as expenses rose. By fiscal 2025 , Azure had exceeded $75 billion in annual revenue, and the broader Intelligent Cloud segment generated about $44.6 billion in operating income for the year.
That does not prove every cloud-era investment was profitable, nor that Meta's AI investments will replicate Microsoft's outcome. It demonstrates something important: the economics of infrastructure look different during construction from how they look once a large market forms around it.
The next layer of value may emerge as companies stop adding AI assistants to old workflows and start designing work around agents, verification, deployment and continuous learning. Better AI capability, better organizational orchestration and broader useful adoption can reinforce one another. Some gains will accrue to cloud providers, others to businesses and customers that never own a GPU.
Standard: The quarter, the decade and the missing multiplier
The capital-markets view begins with financial discipline. Meta's latest figures make the dilemma vivid: $34.91 billion in quarterly lease-inclusive capital spending versus $32.79 billion in operating cash generated. Its 2026 spending outlook is $135 billion to $145 billion . That is a substantial commitment before the eventual scale and pricing of AI services are known.
We should not confuse the short-term accounting effect with an answer about long-term value. Construction reduces today's free cash flow. The resulting assets may enable new revenue, lower operating costs, faster product development and products that previously could not exist. Their economic usefulness can exceed what any one infrastructure company ultimately charges for them.
A generation ago, Microsoft faced a related transition. Its 2016 cloud numbers were a story of rapid Azure expansion alongside rising expenses and lower segment profit. In 2025, Azure had reached an entirely different scale. The lesson is not that the current AI buildout is guaranteed to win. It is that the quarter can reveal the price of investment without revealing the mature market that investment may create.
The mechanism has three connected parts: more capable models, systems able to coordinate and verify their work, and adoption in useful business processes.
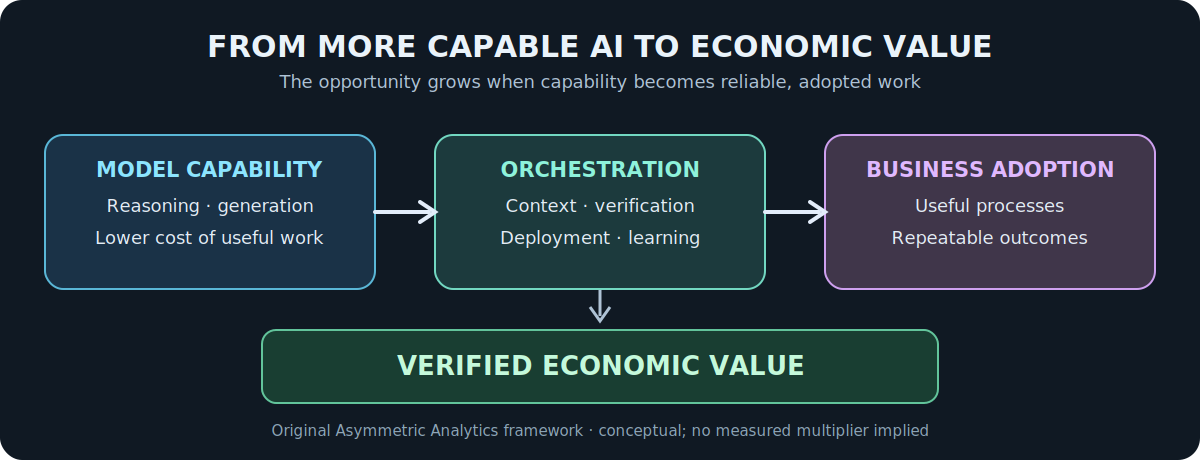
One AI assistant can write a report. An AI-native operation can discover the need, assemble context, write and challenge the report, obtain approval, deliver it, measure whether it worked and retain the lessons. The second system does not merely perform a task faster. It changes the unit of production from an employee completing a step to an organization reliably completing an outcome.
That is why Forrester's July 2026 analysis of 25 agentic development platforms is revealing. It describes competition shifting beyond code generation toward orchestration, enterprise context, governance, model flexibility, transparency and coordination across the software lifecycle. This is a vendor-landscape study, not proof that 25 ordinary companies have achieved the productivity gains. But it identifies the technical direction of travel.
Our Great Capital Collision investigation examined who will finance infrastructure, government borrowing and digital settlement. This investigation asks a different question: after the infrastructure is financed, who captures the economic benefits? The answer may matter more to society than the identity of the winning GPU buyer.
Detailed investigation
### 1. Microsoft's cloud decade is a lesson in horizons, not a promise
The Microsoft fiscal 2016 fourth-quarter disclosure contains a striking contrast: Azure revenue increased 102% from the prior-year quarter, while Intelligent Cloud operating income decreased $443 million, or 17%. Microsoft attributed the decline primarily to higher operating expenses, including research and development and sales to build cloud capacity and innovation.
Those percentages refer to different bases. Azure growth was a product-revenue growth rate; Intelligent Cloud profit was an entire segment's quarterly operating income. Treating them as if 102% more cloud revenue directly caused 17% less Azure profit would be false. The signal is broader: a rapidly expanding infrastructure business can carry the costs of market creation well before its steady-state economics are clear.
By fiscal 2025 , Microsoft said Azure revenue exceeded $75 billion for the year, up 34%, while the Intelligent Cloud segment earned $44.589 billion in annual operating income. That is a different reporting period, and the segment includes more than Azure. We cannot calculate the internal rate of return on the 2016 buildout from these figures. We can observe that the opportunity grew from a fast-expanding service into a major business with substantial profits.
An organization making a multiyear infrastructure decision cannot evaluate it exclusively using the first quarter in which the investment presses on margins. Nor can it ignore investment discipline. Both the capacity to endure the buildout and the eventual demand matter.
### 2. Meta's cash-flow squeeze is real—and the legal charge is a separate story
Meta's October 21 earnings exhibit reported revenue of $64.601 billion, 26% higher than a year earlier, and operating income of $12.988 billion, 37% lower. The operating-income comparison contains a large distortion: a $9.89 billion litigation charge connected to the company's agreement with 52 state attorneys general. Without that charge, Meta stated quarterly operating income would have been $22.88 billion.
Capital investment, meanwhile, is a different cash-flow question. Meta reported $32.79 billion in cash from operations, $34.91 billion in capital expenditures including finance-lease principal payments, and a $2.12 billion free-cash-flow deficit. The legal charge and the infrastructure program should not be described as the same cause. Nor should the cash-flow deficit alone be used to claim the business is unprofitable.
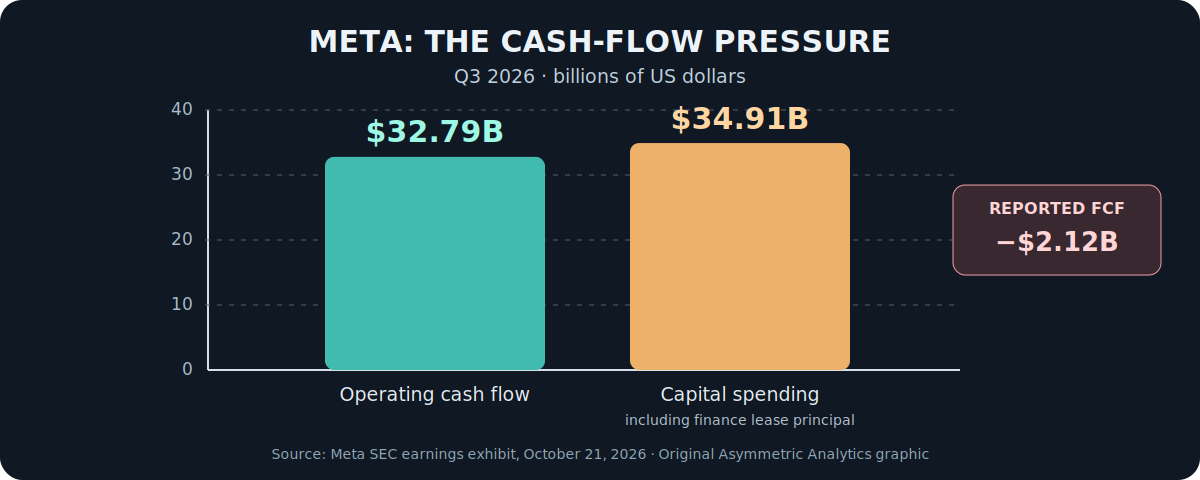
The latest S&P outlook revision matters because financing capacity is not infinite, even for large technology businesses. S&P's projections are forward-looking credit judgments, not reported cash losses for 2027. Meta disputes the gloomy assessment and emphasizes the opportunities. The most useful next evidence will be infrastructure utilization, monetization, financing terms and cash generation over multiple periods.
### 3. The economic value of AI is not identical to the revenue of its builders
Consider a manufacturer using reliable AI workflows to reduce engineering rework, procurement errors and machine downtime. The manufacturer might create far more value than it pays for model inference. Its customers might receive lower prices; employees might move to higher-value work; some roles might disappear. Competitors might imitate the process and compete away some of the initial margin.
In that example, AI infrastructure enables value that does not show up as an equal-dollar increase in the cloud provider's profit. It may appear as an operating-cost reduction, a new market, a better product, faster scientific discovery, increased consumer surplus or a lower price. All are economically relevant, but they reach company income statements differently.
An investor in the infrastructure owner therefore faces two related but distinct questions: how much value does AI make possible, and what share can this particular owner capture after competition, depreciation, energy, financing and operating costs? The first answer can be enormous even if the second disappoints. That is why neither indiscriminate enthusiasm nor indiscriminate dismissal is a sufficient investment thesis.
This also connects to When AI Reprices Money : energy, computing hardware, capital costs and the price of useful inference all influence whether the capabilities diffuse quickly enough to reshape economic activity.
### 4. Better models are necessary. Better organizations are the multiplier.
Model capability matters. But a model that solves a challenging problem in isolation has not delivered a verified business outcome. Someone must provide the correct data, decide what the system is authorized to do, integrate its result with real processes, test quality and recover when execution fails.
For a software company, the relevant chain may be research, specification, implementation, testing, skeptical review, approval, deployment, monitoring, customer feedback and learning. Accelerating the implementation step alone can make the overall operation worse if it floods an unchanged review-and-release bottleneck with more unfinished work.
Forrester describes this exact broadening of the agentic development platform market. The potential differentiators are not just models that write code. They are context engineering, coordination across the lifecycle, governance, auditability, cost transparency and integration with the enterprise's existing toolchain. AWS similarly frames the enterprise journey around the path to operational value , not a demonstration's technical novelty.
The three terms in our diagram—capability, orchestration and adoption—are a conceptual multiplier, not an econometric estimate. They reinforce one another only when the system produces more useful outcomes at acceptable cost and risk. If deployment is fragile or users do not adopt the result, model improvements can be stranded.
### 5. The AI-native company measures completed outcomes
The next organizational transition is from a collection of clever assistants toward a system that knows what happened before, which decisions are binding, who approves exceptions and what constitutes success. Agents can work across functions, but their actions need durable records, permission boundaries, quality evaluations and reliable handoffs.
An AI-native enterprise should be judged by evidence that survives the demonstration room. The operational scorecard might include:
Time to value: elapsed time from a real request to a shipped, usable outcome, including the long tail.
Reliable completion: share of tasks finished without a person repeatedly reviving stalled steps.
Quality and recovery: defects, rollbacks, security incidents and time spent fixing them.
Actual cost: inference, integration, oversight, rework and infrastructure spending per delivered unit.
Learning: whether verified corrections become reusable organizational knowledge and reduce repeated mistakes.
These are outcomes that executives and customers can recognize. A company can have excellent benchmark models and still perform badly against them. It can also use models available to everyone and win through superior integration, trusted data, decision discipline and better execution.
### 6. Who owns the advantage?
Infrastructure is expensive and may confer scale benefits on the firms capable of financing power, chips, interconnect and data centers. Model capability can be expensive to train while becoming cheaper to consume. Workflow knowledge, integrations, customer relationships, trusted data and governance may create a different kind of advantage among users.
The ultimate distribution of returns is not settled. Platforms can capture value through usage, software distribution, control of interfaces and switching costs. AI-native customers can retain some of the productivity gains. Competition can pass much of the benefit to buyers. Workers and governments will face difficult adjustments if tasks, roles, skills and tax bases change faster than institutions can adapt.
A successful technological transition can thus produce high aggregate value and disappointing returns for some capital providers. Historical cloud growth tells us to consider the long horizon. The history of competitive industries tells us not to confuse a growing market with guaranteed profits for every participant.
### 7. What to watch during 2027
Five observable tests can separate a promising thesis from a financially costly enthusiasm:
Utilization: does paid, economically useful inference grow relative to installed compute capacity and power cost?
Adoption: do enterprises move beyond pilots into supervised processes that finish real work?
Unit economics: does cost per verified useful outcome fall even after supervision, audits and rework?
Capture: do infrastructure owners, applications or customers retain the economic savings?
Financing: do cash flow, borrowing terms and depreciation support the buildout without continually needing optimistic refinancing assumptions?
The last test should not dominate the other four. Nor can the other four make financing optional. The productive value of technology and the investors' realized return are different measurements of the same transition.
The deeper investment question
Investors who insist on understanding cash flow are performing an essential service. The error would be to assume that because today's expenditure is visible and tomorrow's organizational change is difficult to measure, the expenditure must be the more important fact.
It is possible for Meta's investment to disappoint its shareholders and for AI to transform business productivity. It is also possible for builders to earn exceptional returns while customers find adoption slower than expected. Both outcomes must remain open until the evidence arrives.
What matters is where the economic gains become real. The infrastructure makes the transition possible. Organizations that learn to deliver useful outcomes with it will determine how large the transition becomes.
Sources and methodology
The Microsoft comparisons use 2016 quarterly results and 2025 annual results , which describe different periods and different scopes. Meta's reported figures and reconciliation come from its October 21, 2026 SEC exhibit . The October 30 ratings development is reported by Reuters and remains an attributed agency judgment. The organizational analysis draws on Forrester's original July 2026 platform landscape and the AWS original framework . The charts are original AA work, and the multiplier is explicitly conceptual rather than an estimated economic relationship.