Europe Is Imploding
By Asymmetric Analytics
Analysis
A companion investigation in The Great Divergence . “Imploding” describes a feedback loop in productive capacity, not a judgment about Europeans and not a forecast of social collapse.
Europe's central economic danger is not simply expensive gas. It is that an energy shock can travel through margins, investment and supplier networks until a temporary shortage leaves a durable productivity problem. The patient way to understand this is to follow the mechanism one step at a time.
1. Energy: a smaller buffer meets a global cargo market
The IEA's Global Gas Security Review 2026 says EU storage entered the heating season at its lowest level since 2013. The Commission and ENTSOG nevertheless found the network physically capable of meeting winter demand. Both can be true: infrastructure can deliver gas while the marginal cargo remains expensive.
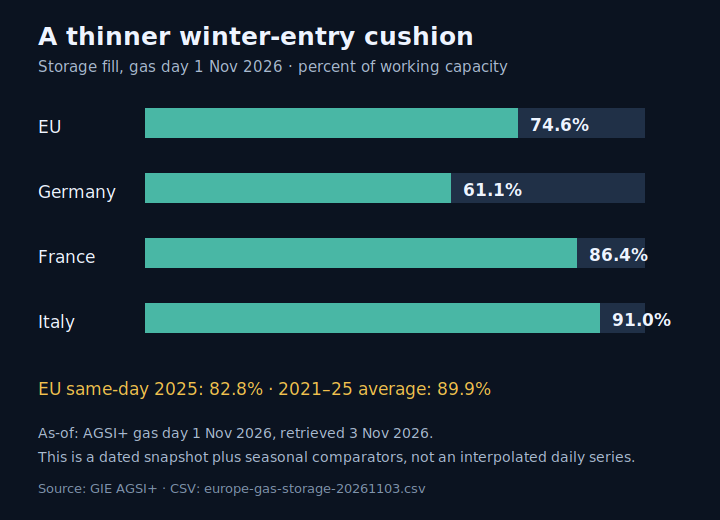
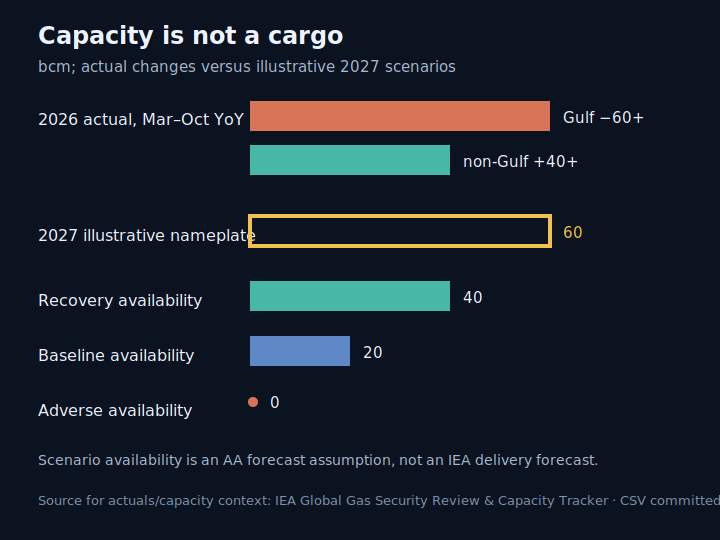
LNG makes regional shortages global. A flexible ship can go to Europe, Asia or South America. The IEA reports that Qatar and UAE loadings fell by more than 60 bcm year on year from March through October 2026, while non-Gulf output rose by more than 40 bcm. Demand destruction—not supply abundance—did much of the remaining balancing.
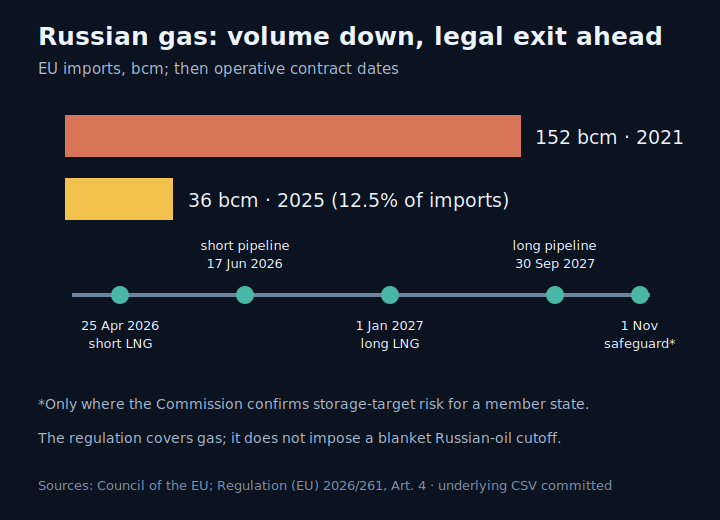
The legal baseline is tightening too. Regulation (EU) 2026/261 ends qualifying long-term Russian LNG on 1 January 2027 and pipeline gas on 30 September 2027, with a possible member-state storage safeguard to 1 November. Russia supplied 36 bcm, or 12.5% of EU gas imports, in 2025 according to the Council . That denominator is imports, not total consumption.
2. Prices and margins: availability is not affordability
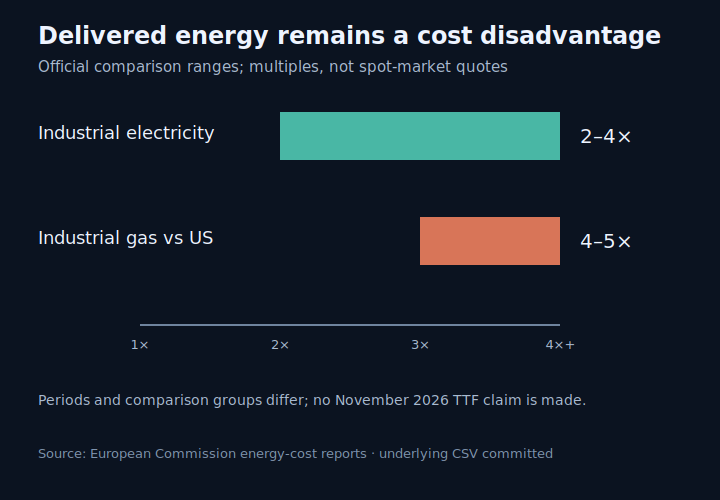
Industrial buyers pay delivered tariffs, not a headline hub price. The European Commission reports that industrial gas and electricity remained roughly two to four times the levels in major trading partners in its latest broad comparison. The Commission's 2025 Euro Area Report , published in December 2024, put natural gas prices paid by European companies at four to five times US levels for its cited period. These are historical comparison ranges, not a November 2026 TTF quote.
For a chemical plant, glass furnace or fertilizer line, energy can be feedstock as well as fuel. When delivered cost rises above the sale price the plant can earn, reducing output preserves cash. That reduction helps balance the gas market, but it is not costless efficiency: some of the apparent resilience is production that did not happen.
3. Production and investment: the next plant matters most
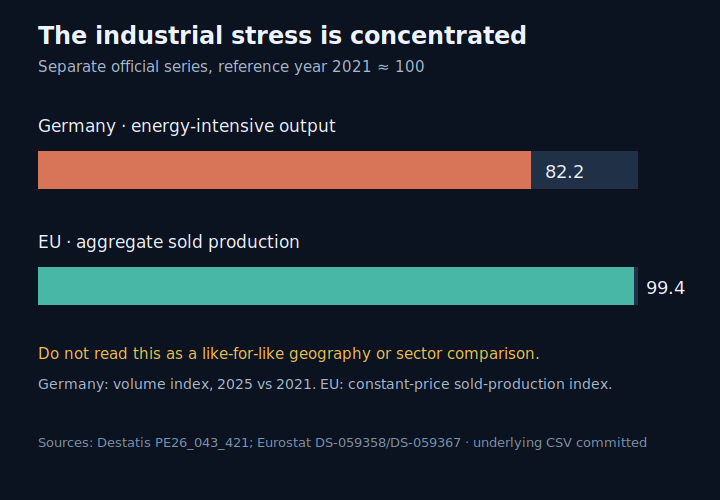
Destatis reports German energy-intensive production in 2025 at 17.8% below 2021. That is German sector data, not an EU-wide statistic. Eurostat's separate constant-price aggregate for sold EU industrial production was near its 2021 level in 2025. The contrast warns against two easy mistakes: declaring all European industry healthy from the aggregate, or declaring all of Europe deindustrialized from Germany's hardest-hit sectors.
Investment is the hinge. A company can keep an old European plant running while placing its next expansion closer to cheaper energy or faster-growing demand. Surveys such as DIHK measure intentions, not completed relocations. Yet intentions matter because supplier tooling, apprenticeships and research partnerships tend to follow repeated capital decisions.
4. Supplier clusters and import dependence
Factories are not isolated boxes. A chemical complex supports maintenance contractors, specialist logistics, testing laboratories and customers that use its outputs. Lose enough anchor investment and the cluster becomes less attractive for the next supplier. Imports can replace the product, but not necessarily the local learning network or tax base.
This is the deeper form of dependence. Diversifying away from Russian pipelines reduced one strategic exposure. Greater reliance on globally traded LNG, imported intermediates and foreign production can create others. The right comparison is not “dependency” versus “independence”; it is which dependencies are diversified, interruptible and affordable.
5. Productivity and fiscal constraints
Productivity grows when workers and capital produce more value per hour. Persistent energy and permitting disadvantages lower the return on modernization. Weaker investment then narrows the future tax base just as governments face defense, ageing and transition costs. Subsidies may preserve a strategic plant, but they transfer the energy disadvantage to the public balance sheet unless the underlying system improves.
The feedback loop is therefore: energy constraint → higher delivered cost → thinner margins → lower output and investment → weaker supplier clusters → greater import dependence → slower productivity and tax-base growth → less fiscal room to repair the system. Every arrow is conditional. Together they describe the risk behind the title.
6. Capacity is not delivery
The IEA LNG Capacity Tracker records a large post-FID project wave. Nameplate capacity is what a facility is designed to produce; cargo delivery also requires completion, feedgas, safe operations, shipping and buyers. The IEA tracker records that Qatar's 43.5 bcm-per-year North Field East expansion was delayed until at least the first half of 2027 after attacks damaged Ras Laffan.
7. Three paths through 2027
Baseline — forecast. Normal weather, partial Gulf restoration and some project ramp-up make roughly one-third of the illustrative new nameplate available. Europe refills storage, but competition for flexible cargoes keeps delivered industrial energy at a disadvantage. Output stabilizes unevenly rather than rebounding broadly.
Adverse — forecast. Colder weather or continuing Gulf disruption absorbs new supply while project delays prevent replacement cargoes. The IEA's cold-weather simulation puts EU storage below 10% of working capacity by the end of March 2027. High prices force another round of demand destruction, with energy-intensive production bearing much of it.
Recovery — forecast. Mild weather, reliable non-Russian pipelines, restored Gulf loadings and timely new plants make about two-thirds of the illustrative nameplate available. Storage refill ceases to compete aggressively with Asian demand; delivered prices converge enough for investment to resume. Recovery requires cargoes and industrial orders, not capacity announcements alone.
What would change our view
The thesis weakens if several observations arrive together: storage exits winter without an exceptional draw; actual LNG loadings recover and new plants deliver close to schedule; the delivered industrial-energy gap closes for multiple years; German energy-intensive output and broader EU production rise together; capital spending returns to European supplier clusters; and productivity plus tax-base growth improves without increasingly large operating subsidies. It strengthens if storage, delivered costs, output and investment deteriorate in sequence despite adequate physical import capacity.
Primary evidence
IEA, Global Gas Security Review 2026 , 3 November 2026, CC BY 4.0.
European Commission and ENTSOG winter assessment , 8 October 2026.
Regulation (EU) 2026/261 , Article 4.
Council of the EU gas-origin series , 2025 values.
Destatis industrial production , February 2026.
European Commission energy prices and costs .
European Commission, 2025 Euro Area Report, page 26 , published December 2024 (historical comparative period).
IEA Global LNG Capacity Tracker , status 1 October 2026.
ELSI trail
This draft reuses admitted nodes only. Candidate edges, with mechanisms, conditions, lags, confidence and falsifiers, are recorded in the companion evidence ledger; publication would not admit them as facts.